


Market intelligence
Latest market intelligence
Fast, evidence-led coverage of the companies and events moving global markets.
Reader favourites
Most read today
The stories readers are following most today.

All coverage
More market stories
NSE:TMPVStock Market
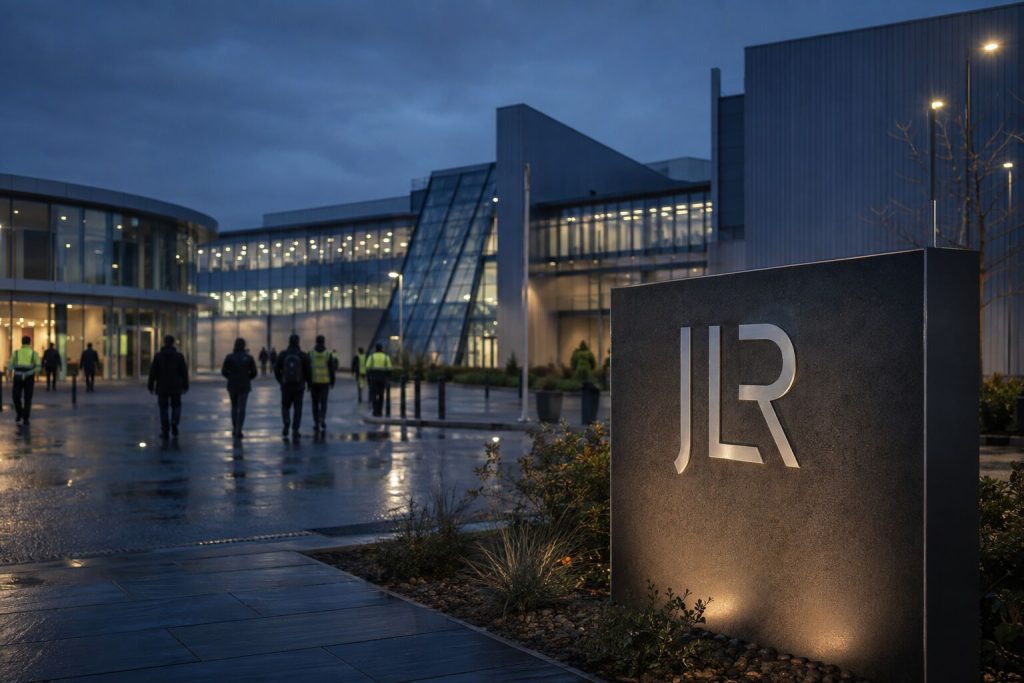
Tata Motors PV Stock Faces Monday Test as JLR’s Reported 4,000 Job Cuts Expose a 7,915-Vehicle Cushion
GAYDON, England, September 6, 2026, 10:21 a.m. BST — Jaguar Land Rover's last full-year wholesale volume finished only 7,915 vehicles above the cost base…
One programme, two levels of certainty
The savings and breakeven objectives are company targets. The workforce number remains a media report.
CONFIRMED BY JLR£1.7bnplanned savings over two years
REPORTED, NOT CONFIRMEDUp to 4,000roles cited by The Times and other outlets
CONFIRMED BY JLR300,000target annual breakeven volume
ELIGIBLE EMPLOYEESSalariedand management team members
JLR has more than 44,000 employees worldwide. A 4,000-role outcome would equal less than 9.1% of that base, though the company has not endorsed the number.
Programme details: JLR statement reported by Sky News. Workforce: JLR annual report.
The earnings-day bounce did not hold
TMPV daily closing prices over the latest 24 NSE sessions.
Last regular trade at . Closing-price record: Yahoo Finance market data. Change calculations by TS2.
Fiscal 2026 volume barely cleared the new floor
The breakeven target is not a sales forecast. It shows how little room last year's volume left above the desired cost threshold.
Breakeven target: 300,000FY26 actual: 307,915
7,915vehicles above the target threshold
2.6%volume cushion versus that threshold
Q1 FY27's 79,288 wholesales produce a 317,152-unit annualized pace. That mechanical run rate is not a forecast; it sits only 5.7% above 300,000.
Reported volume: JLR FY25/26 annual report. Current quarter: JLR investor-relations results. Calculations by TS2.
Savings cannot come at the cost of the product cycle
The restructuring sits beside large cash demands and a crowded launch plan.
TWO-YEAR SAVINGS TARGET£1.7bnmaterials, warranty and fixed costs
FIVE-YEAR INVESTMENT£18bnvehicle platforms and transformation
Q1 FREE CASH FLOW−£998mcash outflow during the June quarter
JUNE LIQUIDITY£5.9bnincluding undrawn facilities
The planned savings equal 9.4% of the five-year investment commitment. Protecting engineering and launch execution is therefore part of the return calculation.
Strategy target: JLR's June investor update. Cash and liquidity: Q1 FY27 release.
Stock MarketUS Stocks
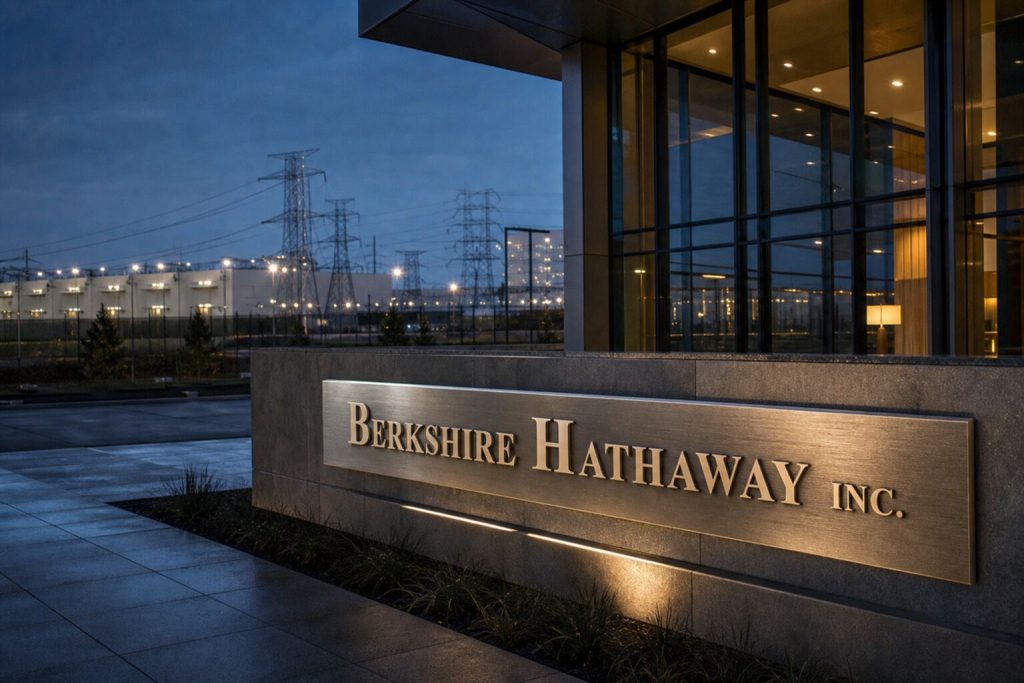
Berkshire’s $10 Billion Alphabet Block Is Down $375 Million Despite Its 6.5% Discount
OMAHA, Nebraska, September 6, 2026, 3:54 a.m. CDT — Berkshire Hathaway Inc. negotiated a 6.5% discount on a $10 billion Alphabet purchase. That cushion…
The discount has not protected the block
Private-placement cost compared with the September 4 close.
Alphabet Class A · 14.212m shares
$351.81$338.46
−3.8% since purchaseAlphabet Class C · 14.360m shares
$348.20$335.31
−3.7% since purchaseCash paid$10.000b
Friday marked value$9.625babout $375m below cost
Transaction terms: Alphabet's SEC filing. Closing prices: GOOGL and GOOG. Mark-to-market calculation by TS2.
Berkshire shares did not follow the AI excitement
BRK.B daily closes across the latest 23 U.S. sessions.
The latest close was 2.5% below August 5 and 4.4% under the period high. Last regular trade at . Price record: S&P Global data via StockAnalysis.
Two AI exposures run on different clocks
One reprices every second. The other must be built and regulated.
Listed equity exposure$35.78bEstimated value of all 105.98m Alphabet shares at Friday's closes, if unchanged
5.2% below the June 30 filing value
Utility demand exposure11 GWData-center load contracted across BHE utilities
2.2 GW reached 2025 peak use; 4.5–5.7 GW projected for 2030
The stock stake delivers immediate price exposure. Grid demand delivers a slower return on physical capital, subject to customer ramp schedules and regulators.
Holdings: Berkshire's Form 13F. Power figures: BHE investor presentation. Current mark calculated by TS2 and assumes no later trades.
The balance sheet absorbs the mark
Scale against insurance-and-other cash and Treasury bills at June 30.
Cash and Treasury bills
$359.2b
Alphabet stake, Friday mark
$35.8b
BHE borrowings
$61.8b
The total Alphabet position equals about 10.0% of the liquidity base. BHE debt sits within operating subsidiaries and is not guaranteed by Berkshire.
Balance-sheet figures: Berkshire Q2 filing. Friday Alphabet value estimated by TS2.
NASDAQ:RGTIStock Market
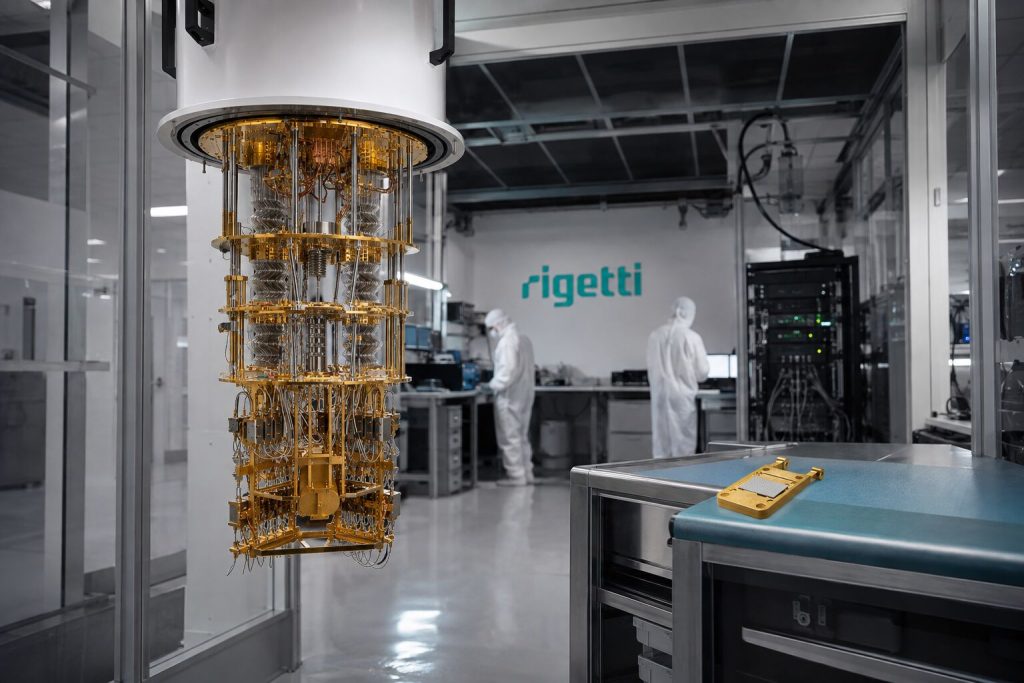
Rigetti CFO’s $375,010 Sale Leaves His Stake Flat; the Stock Trades at 220× Revenue
BERKELEY, California, September 6, 2026, 1:34 a.m. PDT — Rigetti Computing Inc. disclosed an insider stock sale Thursday. Finance chief Jeffrey Bertelsen sold 25,000…
The sale was an option exercise in motion
Bertelsen's direct common-stock balance on September 3.
Before exercise168,067direct common shares
Exercise+25,000options at $0.60 each
Sale−25,000shares at a $15.0004 average
After both legs: 168,067 common shares — exactly the starting balance.
Source: Rigetti's SEC Form 4. The filing also reports 256,250 options remaining.
Rigetti lost the August earnings bounce
Daily closes across the latest 22 U.S. sessions.
Friday's close was 8.0% below August 6 and 19.2% below the August 14 peak. Last regular trade at . Source: S&P Global data via StockAnalysis.
The stock price carries a 220× revenue test
Approximate value bridge at Friday's close.
Equity value$5.073b$15.20 × 333.77m shares
Cash and investments$0.541bJune 30 balance
Approx. enterprise value$4.532bbefore other adjustments
220.5×Enterprise value divided by $20.552 million of annualized Q2 revenue. Annualizing one quarter is a scale comparison, not a forecast.
Sources: the latest share count, Friday's closing price and Rigetti's quarterly figures. Calculations by TS2.
Analysts price outcomes, not today's business
Recent published targets span more than two times the latest close.
$15.20Latest close
$18Low target
$28.71Average
$40High target
+18.4%to the low target
+88.9%to the average target
+163.2%to the high target
Rating counts and targets: Google Finance analyst data. Implied returns use Friday's $15.20 close and TS2 calculations. Targets are opinions, not guarantees.

NASDAQ:GOOGStock Market
Alphabet Stock Ends at $335 After Google Keeps AdX; the Remedy Math Is Still Sealed
NEW YORK, September 6, 2026, 4:05 a.m. EDT — Alphabet Inc. finished Friday at $335.31 after Google escaped a forced sale of its AdX…
The court bounce did not hold
Alphabet Class C daily closes across the latest 23 U.S. sessions.
Friday's close was 6.9% below August 5. Last regular trade at . Source: Yahoo Finance historical data. Prices are rounded.
One threat is gone. The operating rules are unseen.
The public outcome compared with each side's requested remedy.
Justice Department asked
Structural separation
RejectedSell AdX, phase out Google's control of DFP and place 50% of net AdX and DFP revenue in escrow during separation.Google offered
Interoperability changes
Partly unresolvedExpose real-time AdX bids to rival publisher servers, retire unified pricing rules and bar two auction advantages.Court disclosed
Behavioral remedy
Ordered, then sealedNo divestiture. The two-page notice says changes are coming; investors cannot yet see the full technical decree.Sources: the DOJ's revised remedies proposal, Google's counterproposal and AP's report on the court notice.
Alphabet reports the neighborhood, not AdX
Second-quarter 2026 revenue mix. The Google Network line is the nearest disclosed proxy.
$119.80 billion of quarterly revenue
$63.27b Search and other$11.06b YouTube ads$7.30b Google Network$38.17b Other operations
The missing line item
AdX revenue: undisclosedThe $7.30 billion Network category also includes AdMob and AdSense. It represented 6.1% of Alphabet revenue and 8.9% of Google advertising revenue.
Network revenue, year on year−0.7%
Network impressions−12%
Cost per impression+13%
Google ad revenue+14.4%
Source: Alphabet's quarterly filing. Percentages use company figures and TS2 calculations. Other operations are the remainder of total revenue.
Real EstateStock Market
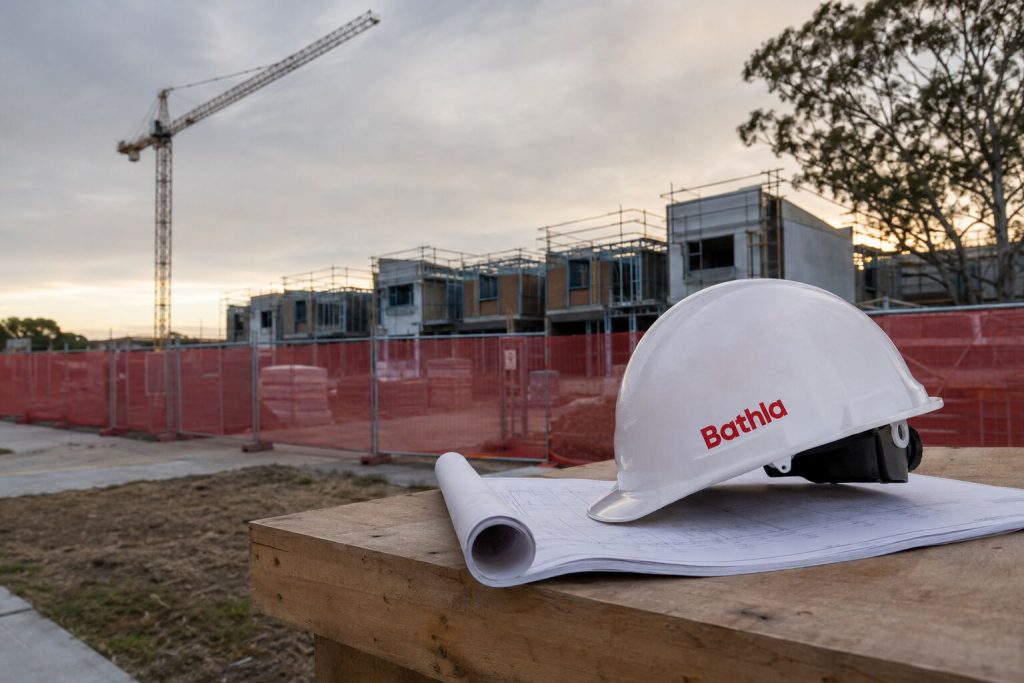
Bathla Collapse: A$4.9 Billion of Sites May Not Rescue A$3.4 Billion of Debt
SYDNEY, September 6, 2026, 5:40 p.m. AEST — Bathla Group's 219 sites carry a preliminary A$4.9 billion stated value against about A$3.4 billion owed.…
The balance-sheet picture looks safer than the cash position
Preliminary site value compared with known debt disclosed at Friday's meeting.
The A$4.9bn figure is preliminary. Assets are illiquid, selling costs matter, and project-specific security can block cash from moving across the group.
Reported by ABC News from the creditors meeting. Ratios are TS2 calculations using rounded figures.
Secured lenders dominate the A$3.4bn claim pool
Rounded creditor categories disclosed by the administrators.
Secured lendersA$3.08bn90.6% of disclosed claims
ATO and land taxA$187mA$145m plus A$42m
Other unsecured + staffA$134mA$130m plus A$4m
Weekly construction support: A$1.0m–A$1.3m
Property on sale or under contract: A$400m
No near-term group cash expected.
No near-term group cash expected.
The categories sum to A$3.401bn before rounding. Figures and liquidity comments come from the September 4 meeting report.
Large enough to hurt funds, still small beside the system
Regulators use different lenses for investor harm and systemic stability.
Estimated Australian private credit
A$200bn
Real estate-related: about halfOther: about half
Bathla's A$3.4bn total debt equals 1.7% of this estimate. That is a scale comparison only; the creditor data do not prove every dollar is private credit.
6%Non-bank lenders' share of Australian financial-system assets
<2%Private credit's estimated share of system assets
MondayDeadline for the immediate Bathla funding talks
ASIC estimates and real-estate concentration come from its private-markets update. System shares come from the Reserve Bank's March review.
NASDAQ:CRDOStock Market
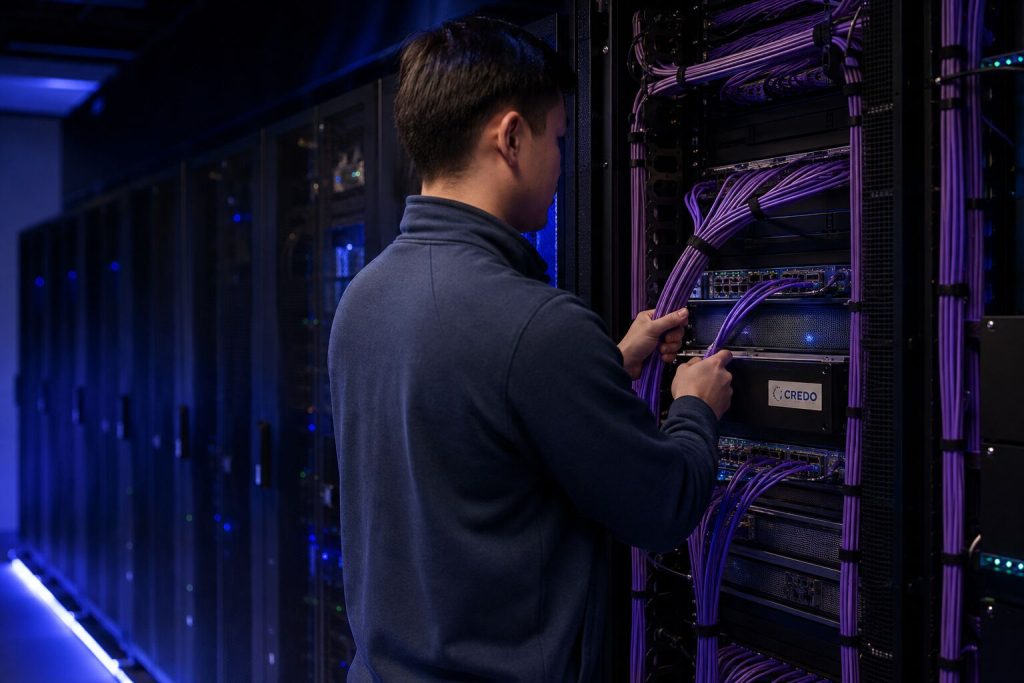
Credo Stock Rebounds 3.9%. Its $97 Million Stock-Pay Bill Is the Next Margin Test
NEW YORK, September 6, 2026, 3:20 a.m. EDT — Credo Technology Group Holding Ltd recovered 3.9% Friday to $170.57. The bounce capped a bruising…
Growth accelerated. GAAP economics went the other way.
First-quarter fiscal 2027 compared with the immediately preceding quarter.
Revenue$479.0m+9.6%from $437.0m
GAAP gross margin64.5%−3.7 ptsfrom 68.2%
GAAP operating expense$188.4m+32.5%from $142.2m
GAAP operating income$120.7m−22.5%from $155.8m
Source: Credo's September 1 earnings release. Changes use unrounded company figures.
The rebound barely dented a 40% retreat
Credo daily closes across the latest 25 U.S. trading sessions.
Last market close at . Source: Yahoo Finance historical data. Prices are rounded.
Next quarter asks for more revenue and more stock pay
Company guidance, concentration disclosures and a midpoint operating model.
Fiscal Q2 guide
Revenue midpoint$530m
GAAP gross margin midpoint63.9%
GAAP expense midpoint$201.5m
Share pay in operating expense$97m
TS2 midpoint model: $137.2m GAAP operating income, or a 25.9% margin. The $97m share-pay assumption equals 48% of guided operating expense.
Concentration and expectations
Customer A: 43%Customer B: 28%Others: 29%
Buy mean rating from nine analysts. The $287.50 one-year target implies 68.6% upside from Friday's close.
Sources: Credo's outlook, its customer disclosure and Nasdaq analyst research. The operating model is an estimate, not company guidance.
NASDAQ:RKLBStock Market
Rocket Lab CFO Sold $8.78 Million. His Existing Common Stake Did Not Shrink
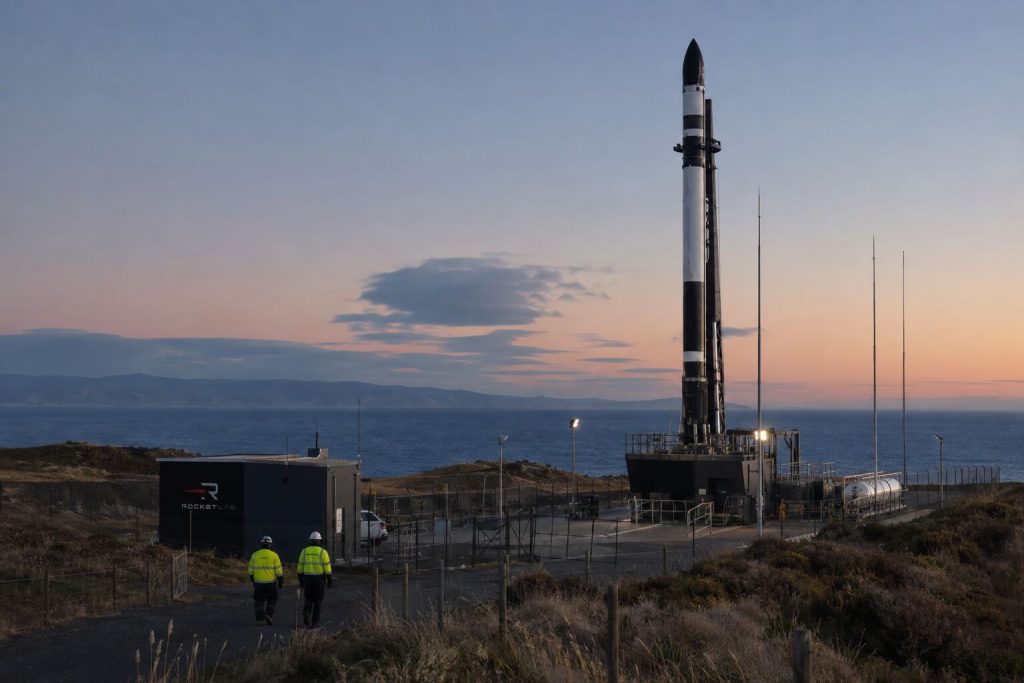
NEW YORK, September 6, 2026, 2:55 a.m. EDT — Rocket Lab Corp. Chief Financial Officer Adam Spice sold 140,157 shares for $8.78 million on…
What actually moved through the account
The option exercise and both same-day sales reported for September 2.
Option exercise140,157shares acquired at $1.09
Open-market sales140,157shares sold at $62.63 average
Direct common stake1,155,967unchanged from before exercise
Gross proceeds: $8.778m · exercise cost: $0.153m · pre-tax spread: $8.625m
TS2 calculation from Rocket Lab's Form 4. Taxes, fees and any withholding are excluded.
The sale came after a 24% retreat
Daily closes over the latest 25 U.S. trading sessions.
Last market close at . Source: Yahoo Finance historical data. Prices are rounded.
What remained after the sale
Common holdings use Friday's $64.26 close. Option value is gross intrinsic value.
Direct common shares1.156mabout $74.3m
Common shares in trust250,000about $16.1m
Options remaining2.383mabout $150.5m intrinsic value
Options exercised and sold: 140,157Options still reported: 2,382,668
5.6% exercised94.4% remained
Source: SEC Form 4 and TS2 calculations. Market values are snapshots, not realizable net proceeds.
NASDAQ:ASMLNASDAQ:MU
ASML Stock Adds $26 Billion on Someone Else’s Bull Case. The Memory Read-Through Is Real
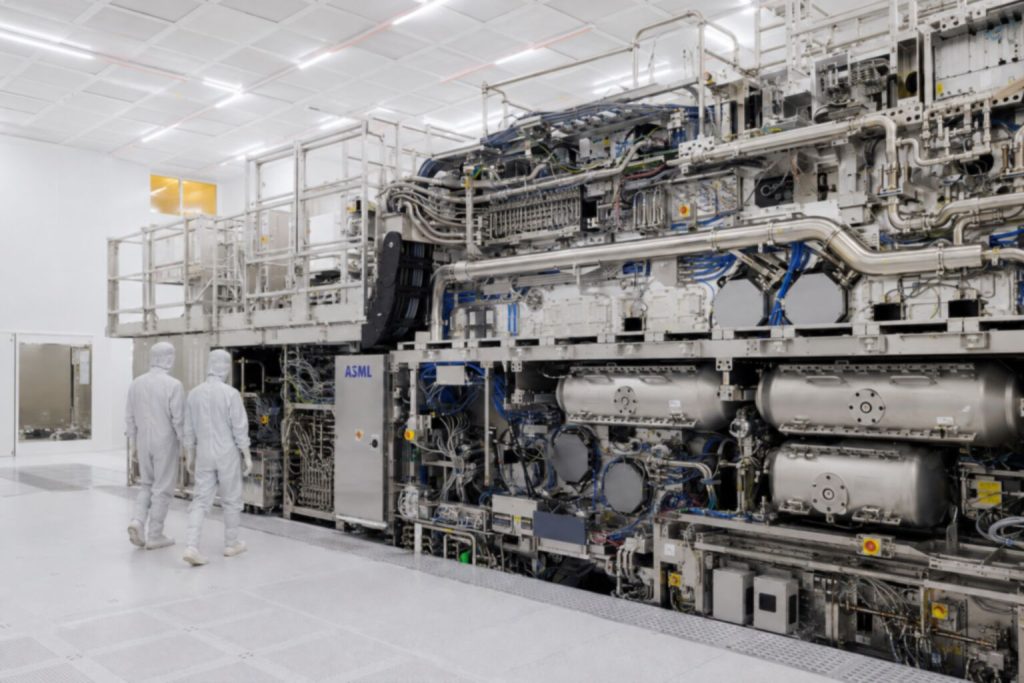
NEW YORK, September 6, 2026, 2:31 a.m. EDT — ASML Holding N.V. gained 4.17% on Friday, adding roughly $26.5 billion to its equity value.…
Friday repaired only part of the August slide
Daily Nasdaq closing prices for ASML's U.S.-listed shares.
Last market close at . Source: Nasdaq historical data. Prices are rounded.
The 2026 revenue bar kept moving higher
Company guidance at three reporting dates. Bar length compares each range midpoint with July's €44 billion midpoint.
January
€34bn–€39bn
April
€36bn–€40bn
July latest
€43bn–€45bn
ASML also guided for a 54% to 56% gross margin this year. Source: ASML Q2 2026 results.
CryptocurrencyStock Market
ADA Rises 4.8% as RealFi Prepares to Test Cardano’s $64 Million Stablecoin Base
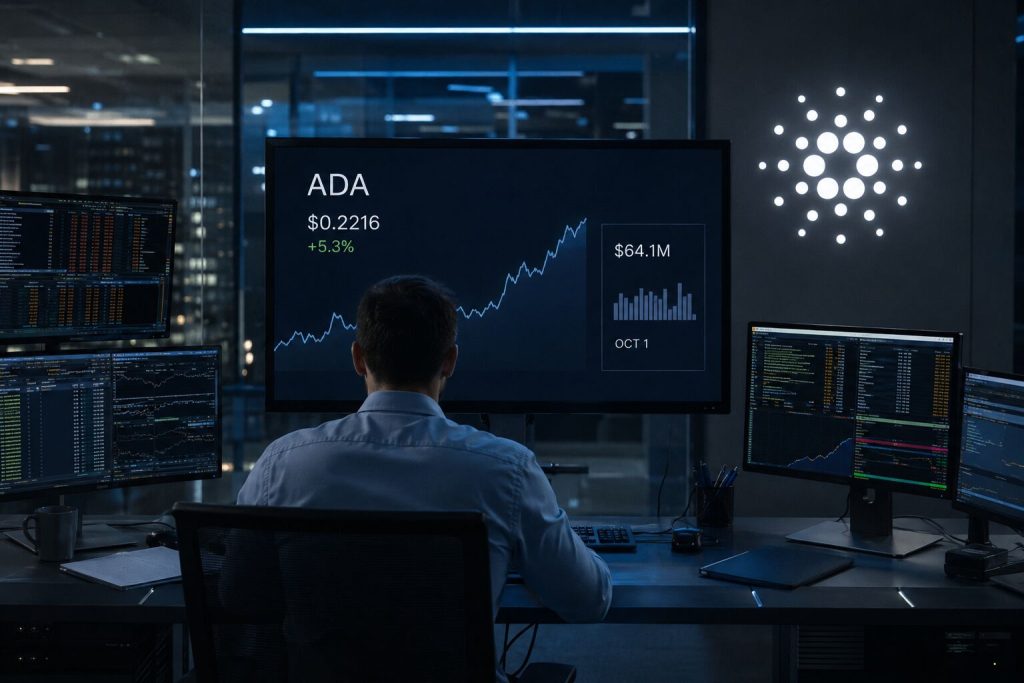
NEW YORK, September 6, 2026, 2:00 a.m. EDT — Cardano's ADA token rose 4.8% to $0.2214 early Sunday. The move lifted its implied market…
ADA's seven-day rebound
Four-hour observations from a continuous crypto market. The last point is current to the timestamp below.
As of . Source: CoinGecko. Prices are rounded.
Cardano starts from a much smaller dollar base
Dollar-pegged stablecoins circulating on three networks. Figures are snapshots, not measures of transaction volume.
Ethereum$148.5bnabout 2,316× Cardano
Solana$16.6bnabout 259× Cardano
Cardano$64.1mthe launch runway
Cardano dollar-stablecoin mix$64.1m total
Bridged 65.6%Native 34.4%
Source: DeFiLlama stablecoin data for September 6. USD-pegged assets only; values rounded.
CryptocurrencyStock Market
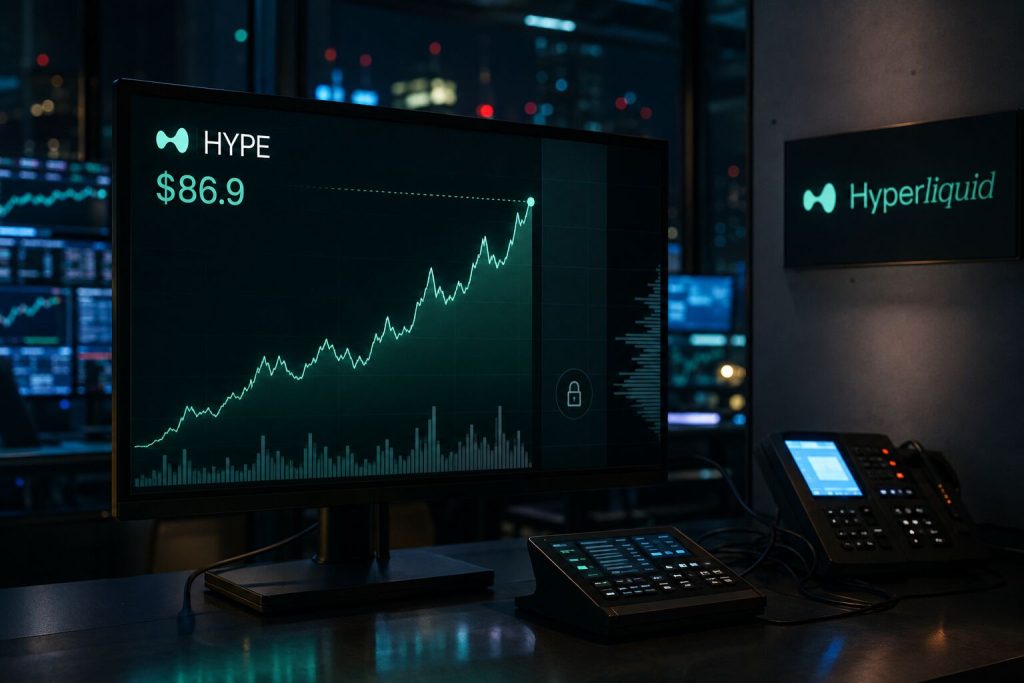
HYPE Trades 1.2% Below Its Record. The $863 Million Unlock Is Only a Ceiling
NEW YORK, September 6, 2026, 1:34 a.m. EDT — Hyperliquid's HYPE token traded at $86.98 early Sunday, just 1.2% below its record. A scheduled…
HYPE is back at the record's doorstep
Official perpetual-market marks, with the all-time high shown as a reference. This is a checkpoint chart, not a continuous price series.
As of . Sources: Hyperliquid Info API documentation and CoinGecko.
What different claim rates would mean
Illustrative values at $86.98. These are arithmetic scenarios, not forecasts of sales.
1%
99,200 HYPE · $8.6m
5%
496,000 · $43.1m
10%
992,000 · $86.3m
25%
2.48m · $215.7m
100%
9.92m · $862.8m
TS2 calculations from the scheduled allocation and current HYPE mark. A claim does not establish a sale.
IPO NewsStock Market
Pranav Constructions IPO Opens Monday. Dilution Lifts the P/E Math to 19.6×
MUMBAI, September 6, 2026, 10:24 a.m. IST — Pranav Constructions Limited will open its ₹351.03 crore initial public offering on Monday. Already, anchor investors…

CryptocurrencyStock Market
Solana Price Rises 4.3% While U.S. ETFs Post $5.2 Million Outflow
SINGAPORE, Sept. 6, 2026, 12:20 p.m. SGT — Solana traded at $106.13 on Sunday, up 4.3% over 24 hours. Its marked value grew by…
Live weekend tape
SOL moved from $101.78 to $106.23
Hourly Kraken closes across the latest 24-hour window. The final bar is still forming.
As of . Source: Kraken SOL/USD hourly OHLC.
Friday’s U.S. fund ledger
Two products accounted for every dollar of the outflow
Net flow on Sept. 4, 2026, in U.S. millions.
NYSEARCA:BSOL−$2.8m
NYSEARCA:VSOL$0.0m
NYSEARCA:FSOL−$2.4m
NYSEARCA:TSOL$0.0m
NYSEARCA:SOEZ$0.0m
NYSEARCA:GSOL$0.0m
Total: −$5.2 million. Source: Farside’s daily U.S. Solana fund data.

Federal ReserveNASDAQ:NFLX
Netflix Stock Drops 5.3% as 33% UK Hike Tests a Fast-Growing Tier
LONDON, Sept. 6, 2026, 4:40 a.m. BST — Netflix Inc. lost 5.35% on Friday, erasing about $18.4 billion of equity value. Shares closed at…
Friday broke a quiet five-session run
Netflix adjusted closing price, Aug. 31 through Sept. 4
Thursday close$82.67
Friday close$78.25
Friday move−5.35%
Five official-session closes from Yahoo Finance market data. Current through .
Three plans, three different price shocks
Monthly UK list price · September 2026
Standard with Ads£5.99£7.99+33.4%
Standard£12.99£13.99+7.7%
Premium£18.99£20.99+10.5%
Prices and percentage changes verified against the reported UK schedule. New customers pay immediately; existing accounts change after notice.
One trading day outweighed the UK math
Different measures, shown only to establish scale
Friday equity-value loss$18.4bn
31×–45×
Mechanical annual UK revenue uplift$0.41–0.59bn
The revenue range assumes unchanged reach, mix and retention. It is not profit or valuation. Inputs: Barb household data, reported plan prices, Sept. 4 GBP/USD and Netflix's filed share count.

CommoditiesNSE:HDFCBANK
Nifty 50 Ends Fourth Losing Week at 23,897.70 as Oil Stocks Mask Auto Rout
MUMBAI, Sept. 6, 2026, 8:46 a.m. IST — India's Nifty 50 ended a fourth losing week at 23,897.70. The benchmark lost 1.15% in five…
Four Fridays, four lower closes
Nifty 50 price index, Aug. 7 through Sept. 4
Aug. 7 close24,570.65
Sept. 4 close23,897.70
Four-week move−2.74%
Friday closes from NSE's Aug. 7, Aug. 14, Aug. 21, Aug. 28 and Sept. 4 index files. Current through .
Oil producers cushioned the shock
Index moves from Aug. 28 through Sept. 4
Nifty Oil & Gas+1.08%
Nifty Bank−0.22%
Nifty IT−1.88%
Nifty Auto−3.95%
The full 5.03-point oil-versus-auto spread comes from NSE's Aug. 28 and Sept. 4 closing files. Bars share a five-point scale.
The new pre-open sequence
Effective Monday, Sept. 7 · regular trading still begins at 9:15
9:00–9:05Market and limit orders may be entered, changed or cancelled.
9:05–9:10Limit orders only. The system closes entry randomly in the final two minutes.
9:10–9:12Opening-price calculation, order matching and trade confirmation.
9:12–9:15Unmatched eligible orders move toward continuous trading.
The 15-minute session length is unchanged. See the member implementation summary and linked NSE circular.
Stock Market
Singapore T-Bill Yield Hits 1.60% as Big-Bank Deposits Lag
SINGAPORE, Sept. 6, 2026, 10:52 a.m. SGT — Singapore's latest six-month Treasury bill pays 1.60% a year. That is 30 basis points above UOB's…
The six-month cash hurdle
Published annual rates; eligibility and lock periods differ
Latest T-bill1.60%BS26117A · S$1,000 units
UOB six-month FD1.30%S$10,000 fresh-funds minimum
OCBC six-month FD1.25%Online · S$20,000 fresh funds
October SSB · year one1.65%Longer holding choice · monthly redemption
Rates checked Sept. 6. Sources: Monetary Authority of Singapore, UOB, OCBC and the GX26100Z Savings Bond notice.
Six-month cut-offs have moved higher
Auction yield, annualized, from Feb. 26 through Aug. 27
February low1.36%
Latest result1.60%
Six-month move+24 bp
Current through . The series is compiled from MAS auction results; MAS's current-answer service independently confirms the latest cut-off.
Match the instrument to the money
The highest displayed rate is not always the highest usable return
Cash · S$1,000+T-bill has the clean small-balance edge
The latest 1.60% rate tops basic six-month offers at UOB and OCBC, while requiring a smaller denomination.
Cash · S$50,000+Conditional top-up offers can edge ahead
OCBC's 188-day structure blends to about 1.653%, subject to incremental-balance and fresh-funds rules.
Flexible horizonThe SSB starts at 1.65%
GX26100Z pays 1.65% in year one and averages 2.32% across ten years, with monthly redemption.
CPF Ordinary Account1.60% creates a 90 bp shortfall
Current OA interest is 2.50%. On S$50,000, the six-month opportunity gap is about S$224 before timing effects.
CPF rate source: CPF Board, July–September 2026. Calculations use 182 days and annual simple rates.
CryptocurrencyStock Market
XRP Reclaims $1.42, but ETF Assets Trail Net Inflows by $210 Million
NEW YORK, Sept. 5, 2026, 10:26 p.m. EDT — U.S. spot-XRP funds now hold about $1.48 billion of assets, roughly $210 million less than…
A rebound, then a $1.47 rejection
Kraken XRP/USD references at 4 p.m. ET; final point is live
Latest$1.4162
24-hour change+1.3%
Seven-day change+1.8%
As of . Sources: Kraken hourly market data and CoinGecko. Prices vary by venue.
One red day broke the streak
Net creations and redemptions across five U.S. spot-XRP funds
Mon. · Aug. 31+$5.64m
Tue. · Sept. 1+$14.38m
Wed. · Sept. 2−$7.20m
Thu. · Sept. 3+$6.14m
Fri. · Sept. 4$0
Five-session net result+$18.96 million
Source: SoSoValue figures archived by CryptoTuts. Zero denotes no reported net creation or redemption.
Inflows exceed the assets left today
Rounded fund-complex figures as of Sept. 4
Cumulative net inflows$1.69bnNet investor capital since launch
Current reported AUM$1.48bnPresent value of fund assets
Arithmetic differenceAbout $210 million12.4% of cumulative net inflows
Calculated from fund-flow and AUM data attributed to SoSoValue. This comparison is an analytical estimate, not a fund-level accounting loss.